
Data is beautiful.
It reduces the confusing, chaotic noise of life and humanity into numbers and quantifiable patterns. And as a data analyst, it may feel like you have the keys to the world.
The information you have, the problems you can solve…
If only people would just listen!
You see, data alone isn’t enough.
If you want to make an impact, there’s one skill you need to learn: narrative construction.
Why is narrative construction important in data storytelling?
Data storytelling isn’t a new thing, but it is becoming more and more valuable as consumers and stakeholders realize the utility and value of well-presented data.
Storytelling helps people to make sense of data and allows them to connect with the material on a deeper level, as it creates an emotional connection and gives meaning to data points.
(Here are 5 more reasons why data and storytelling should go hand in hand.)
Data analysts are often tasked with taking large data sets and turning them into narratives that people can understand. You can do this in a lot of ways, like using animation, videos, cool graphics, etc.
A good data story combines data with visual elements driven by a narrative. All three factors deployed together can be very effective in driving results and engaging an audience.
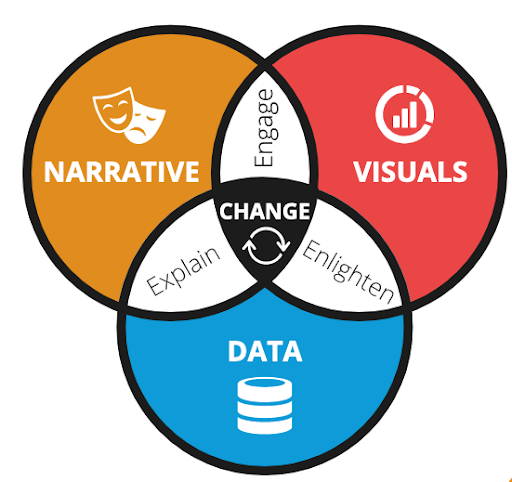
(Source: Datacamp)
However, data and visuals mean nothing without the narrative.
Don’t get me wrong. Grabby visuals and graphics are great and are a vital part of data storytelling.
But what draws people in is the story.
The narrative.
The human brain is wired to receive and retain information through stories. We’re more likely to remember stories than numbers, and we use stories to understand the world around us.
Communicating technical and data concepts has always been a challenge, but through the power of narrative, data analysts can take complex ideas and make them accessible to a wider audience.
A well-constructed narrative has the power to inspire and motivate others to take action. Data presented with a story can be incredibly powerful, informing decisions, generating ideas, building connections, and sparking conversations.
6 narrative construction tricks used by best-selling authors
Very few data analysts come from a background of literature and story-telling, but that doesn’t mean you can’t learn from the pros.
Here are six tricks used by bestselling authors that can help data analysts construct powerful narratives:
1. Start with the end in mind
Bestselling authors know the importance of a strong, meaningful ending, and they plan their stories around it. The same holds true for data narratives. Know where you’re going, what your conclusion is, and how you’re going to get there.
With this in mind, you can better select the pieces of data that contribute meaningfully to your story and discard the rest. Authors call this process “killing your darlings”.
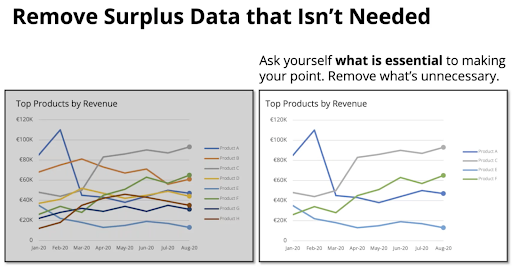
(Source: Datacamp)
An interesting data point does not always make the narrative stronger. By removing or condensing irrelevant data points, you can draw the focus toward the most important data and strengthen your central conclusion.
By keeping things simple and intentional, you’ll come out with a clearer and more memorable message.
2. Make it personal
Data is impersonal, but stories don’t have to be. People respond more emotionally to storytelling when there are characters they can empathize with or recognize within the story.
When constructing data narratives, try to think of ways you can turn numbers into people. Better yet, protagonists.
It doesn’t have to be a real person. You just have to draw a line between the reader, your data, and someone they can recognize. If your audience can see someone they know or meet someone new within your data set, they’ll be more likely to meaningfully engage with it.
This means that you have to know your audience and what they can relate to the most. So do the groundwork. Think about their wants and needs, their concerns, and their stories.
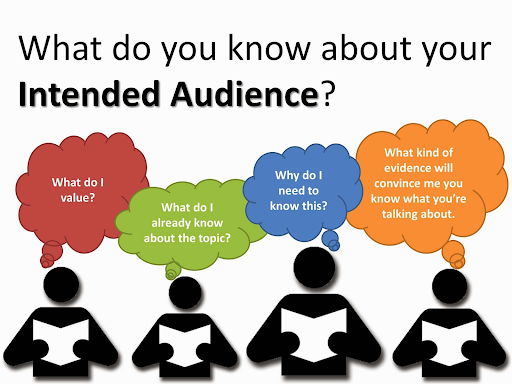
(Source: Amy Lynn Hess)
Bestselling authors pitch for a specific audience, and you should too.
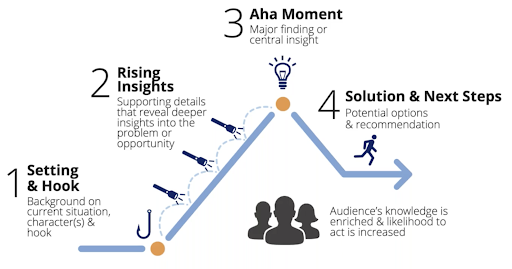
3. Utilize a narrative structure
Narratives come in all shapes and sizes.
A basic linear structure has a beginning section, a middle section, and an end section. Simply constructing your data story within these sections will help you create a story that is compelling and easy to understand.
(Source: Datacamp)
Other narrative structures are just iterations of this basic structure.
For example:
- The hero’s journey – a narrative structure popularized by Joseph Campbell, follows a protagonist’s journey from ordinary life to an extraordinary quest and back again.
- Three-act structure – a narrative structure with a beginning, middle, and end, where the middle contains a point of reversal that changes the dynamic of the story.
- The Data Cycle – an iteration of the three-act structure where data is transformed from raw to refined and then used to come up with an actionable conclusion.
- Viewpoint narrative – a narrative that follows the story of one individual, usually the protagonist.
- Circular narrative – a narrative that starts and ends in the same place or with the same event.
Once you understand the different types of narratives, decide which one is best suited for your data. They all have their advantages and disadvantages.
For example, circular narratives work great for data that is cyclical in nature but may not be suitable for stories that don’t have a natural arc. A hero’s journey or quest narrative may be better for stories that involve a problem or obstacle to overcome.
Consider the picture that your data is painting and what kind of structure will help frame it best.
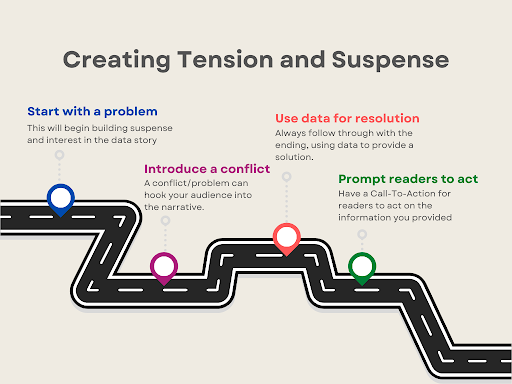
4. Create tension and suspense
Bestselling authors know how to keep readers on the edge of their seat. They use tension, suspense, and anticipation to build interest in their stories.
(Source: Shane Duggan)
For data narratives, this could mean introducing a problem that needs solving or suggesting a consequence if action isn’t taken.
Conflict is a key ingredient in stories. Without it, your points will have no weight, and the successes will have no meaning.
By introducing a conflict or a problem, you can hook your audience and draw them through the narrative with the need for a resolution.
But make sure that you follow through with the ending. There are few things audiences hate more than an unresolved ending.
You can use your data to provide a solution or a resolution to the conflict. This can also act as a call to action, prompting readers to act on the information you’ve provided.
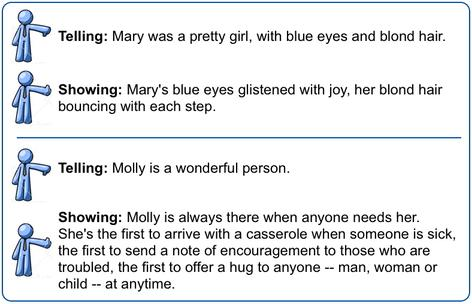
5. Show, don’t tell
This is a pro-writer mantra. Many a fevered writer has turned to it in the depths of a late-night wordy panic.
And data analysts can benefit from it too.
Telling is when you present the bare facts and figures as they are, with no accessories. This can be useful in presenting objective information, but it doesn’t hold readers’ attention.
What you want to try doing is showing.
Showing is when you introduce and lead the readers on a journey toward the facts. This is where all the tricks listed above converge.
(Source: University of North Georgia Press)
In order to effectively create data narratives, avoid telling your audience what to think. Instead, provide evidence and meaningful visualizations that illustrate why something is true or important.
Use descriptive and emotional language to paint a vivid picture. As Stephen King said, “description begins in the writer’s imagination but should finish in the reader’s.”
For example, by using language like “urgent” and “immediate”, you are setting the stage for the audience to connect and imagine an emergency scenario. This creates a sense of crisis that compels readers to act.
As much as possible, make sure that your descriptions are specific and vivid. Showing your reader a specific and relatable example will help them understand your data and better connect with it.
Not all data can be “shown,” and bringing emotion into some datasets may actually be harmful. For example, financial data should always be presented in a factual, neutral way to avoid being misleading.
Use your discretion and common sense when deciding how much “showing” to do and in what way. Telling in itself is not a bad thing, and your audience may appreciate the more succinct approach.
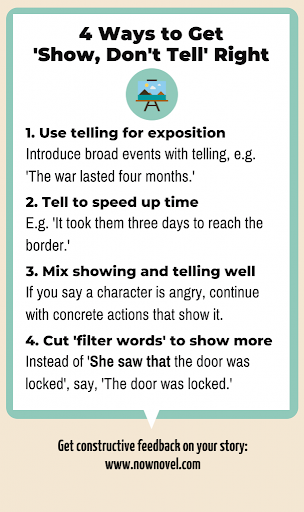
(Source: Now Novel)
6. Provide insight
At the end of the day, data storytelling isn’t just about entertaining your audience. You need to provide insights that are actionable and relevant.
End your narrative with an insightful conclusion. Summarize the key points and draw a conclusion that your readers can take away with them.
Providing actionable insight adds value to your data by making it useful and relevant.
(Source: Forbes)
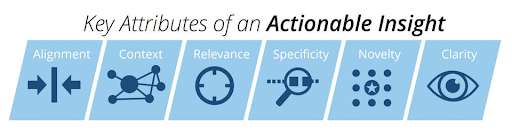
Keep in mind these 6 points when you’re trying to draw out some actionable insights from your data:
- Alignment: Is the action proposed aligned with the audience’s existing strategies?
- Context: Do you have enough supporting details to back up your conclusions?
- Relevance: Are you delivering the right message to the right people?
- Specificity: Is the scope of the data too broad? Does the conclusion you draw explain the why’s of a specific situation?
- Novelty: Is this new information?
- Clarity: Can you communicate it clearly? Is the data convincing?
Insight is the most valuable outcome of data storytelling. If your readers can’t make use of the data, then it’s no better than a bedtime story.
So what’s the big deal?
Capturing your audience’s attention is a skill set that few university degrees prepare you for. In fact, many in the data field look down on humanities fields such as storytelling.
But outside of the classroom is an audience who needs to be engaged in the data’s story.
The world has more data than we know what to do with. Data analysts who arm themselves with some tricks from the “soft skills” toolbox offer an absolutely invaluable service that can bring some much-needed clarity to overwhelming noise.
That’s why good data and good stories should always go hand in hand. By harnessing the power of both in data storytelling, we can fight against the true enemy; misinformation.


