
Would you like to take your content marketing to the next level?
Using data in your content marketing is what will help.
As the name suggests, data-driven storytelling is creating stories based on data.
Why Use Data for Storytelling?
There are two heavily interconnected reasons here:
- Data makes stories more trustworthy
- Storytelling makes data easier to understand and relate to.
In short, that’s the perfect match right there: Data helps influence how people perceive a topic. Stories are how we help numbers make sense.
A story helps marketers communicate complex ideas and accelerate the decision-making process for decision makers.
Data makes stories share-worthy and link-worthy.
With all of that in mind, data-driven storytelling can help boost the performance of many of your current marketing tactics:
- Link building (just about any form of data is known to attract links, especially if it’s packages as a story)
- Viral marketing (data told as a story drives people to uncover theories and concepts they’ve never thought of previously, so they are likely to share it around)
- Sales (thanks to its ability to simplify and hence accelerate the decision making process)
How to Create a Good Data-Driven Story
There are three key factors that make a good story:
- It needs to be relevant
- It needs to use good visuals
- It needs to be clear and relatable
Now, add data to that equation.
As it sounds pretty vague, let’s look at one perfect example of all of that done absolutely ingeniously. Meet the “Examining Inequality” report from Bill & Melinda Gates Foundation. The report examines how people are actually born unequal, visualizing how for someone born in a poor country getting to a healthy, quality life requires overcoming “hurdle after hurdle after hurdle.”
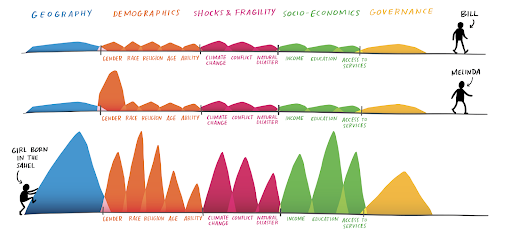
The report uses publicly available data to tell a story of a girl born in the Sahel, one of the poorest regions in the world, and how it takes it longer for her to achieve what people in the United States may take for granted.
The trick is, we all knew that already but the way this story is built makes it eye-opening. By the time we are done reading and looking at the visuals, we are saying to ourselves, “This shouldn’t be like this!”
The report closes with another convincing part: How the foundation is making a difference (and how you can help as well).
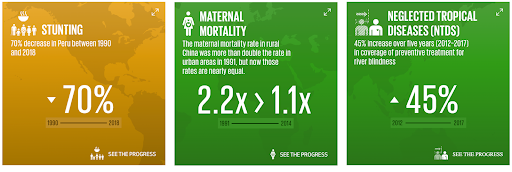
This is another set of data that makes a perfect conclusion and drives action.
That’s exactly the goal of data-driven storytelling: Data brings up points to base your story on, and then data provides solutions to drive action from the readers. This particular story accomplishes everything, from driving conversions (donations) to attracting links and shares.
Data-driven stories can be text-based and visual (or both as the above example). They can be based on public and private data (or both as, again, the above example).
Let’s see if we can learn create stories using data:
Use Public Data to Tell Stories
There is a ton of data available publicly. Some tools are free, some of them are paid, but there’s a variety. Let’s look at the three main tools:
Google provides a huge amount of data you can use to re-package into beautiful stories. Here are a few ideas for you to get started:
- Here are a few great ideas on using Google Trends for writers: Some very actionable tips you can implement while reading.
- Here’s another example of using Google Trends to tell a story of a brand during global lockdowns.
- Here’s my own guide on using Google’s Autocomplete as the data source.
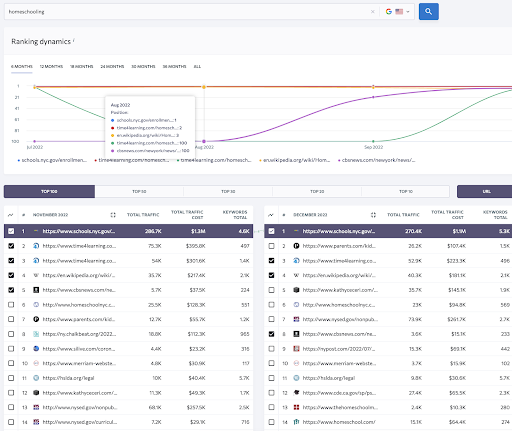
There are multiple platforms that use Google to collect even more data. SE Ranking offers an advanced keyword suggestion tool that reports on ranking fluctuations, traffic costs and related trends. It is a great source of data (albeit not free).
Zoho Surveys
While the above tools are free, Zoho offers a paid tool allowing anyone to collect data by surveying people.
Zoho Market Research Surveys offers a few targeting options allowing you to collect responses based on an industry, age, gender, location and more. 1000 responses cost about $2000.
It is not cheap, so you need to have a clear idea of the kind of a story you are shaping here before investing. There are many more market research tools you can use to create stories that fit your niche and product.
GOV Resources
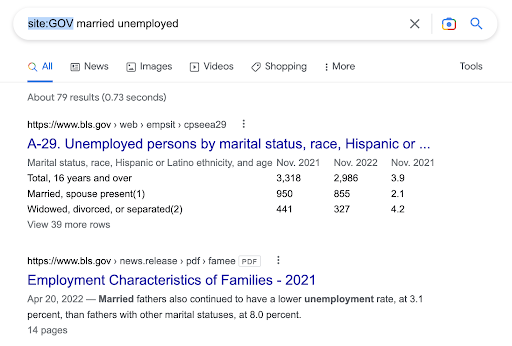
Government provides an abundance of freely accessible data for you to repackage into convincing stories. You can find lots of that data using Google and site:GOV filter to force Google to only search official government sources:
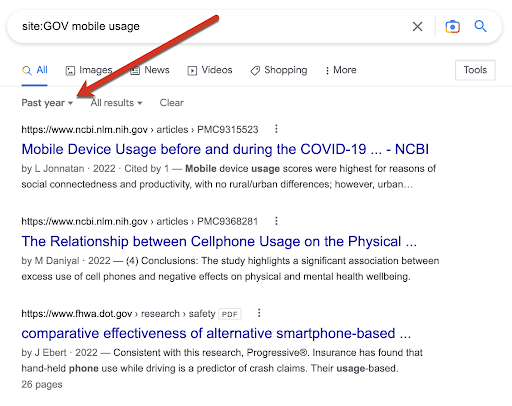
You can also filter results by publication date to see more recent data:
Wikipedia is another great source of both data and inspiration. So I would highly recommend monitoring the most important Wikipedia pages in your category. Visualping can help you do that easily, so you never miss the most recent updates or data added to anyWikipedia page (or pages).
Use Your Customers’ Data to Tell Stories
This is the data you own (provided your customers have granted you their permission to use that data). It includes:
This sort of data can make perfect social proof, especially case studies illustrating your customers’ success stories with your products.
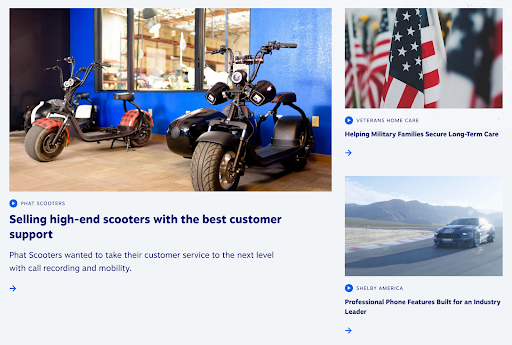
Nextiva is a great example of promoting its contact center solutions by using its customers’ stories.
Apart from publicly available social proof, private data-driven stories make perfect material for sales materials that your team can utilize to close sales. Visual case studies make great Tumblr content, Instagram posts and even Pinterest boards.
Conclusion
In short, data-driven storytelling is more than using data to create nice visuals. It is about making data explain real life.
Data can make any story more convincing and shareable, if you use it well. The stories are there not to beautify your data, but to make it more relatable and easier to understand. It may take quite a lot of time brainstorming and researching before you come up with the right data and the right story (as well as the right package). Good luck!


